3 Steps to Improve Your Product Descriptions with Returns Data

This post originally appeared on gepard.io.
It’s widely known that product descriptions are a central aspect of your product data, and are critical to the customer conversion path.
These descriptions, along with product images and other information, can improve your SEO, drive conversions, and even prevent returns.
But how can you identify gaps, or opportunities, within your product descriptions?
How To Improve Product Descriptions with Return Data
Data from ecommerce returns illuminates the other side of the customer experience. It provides valuable information that is otherwise unavailable.
When a customer returns a product, it does not mean that the product was no good. It means that the customer’s expectation of the product did not match the reality of the product.
To put it another way – you might not need to change the product at all, you may just need to enhance the different pieces of content, such as product descriptions, that that come together to represent the product.
In that way, returns data can empower you to reduce your return rate and make improvements to your product content.
The goal, here, is to identify why customers are returning your products so that you can locate potential gaps in product descriptions.
But the challenge is navigating from information to insight, and more importantly, doing so at scale.
Step 1: Narrow Down Product Opportunities
In order to find precise and actionable insights you can use for product descriptions, it’s usually best to narrow down your focus.
And so, the first step to finding gaps in your product descriptions is to identify a handful of products that show room for improvement in terms of returns.
You can start by looking at the return rate, which can either be calculated as the price returned divided by the price paid or the units returned divided by the units ordered.
For the purpose of this example, we will examine the returns data of a women’s fashion brand.
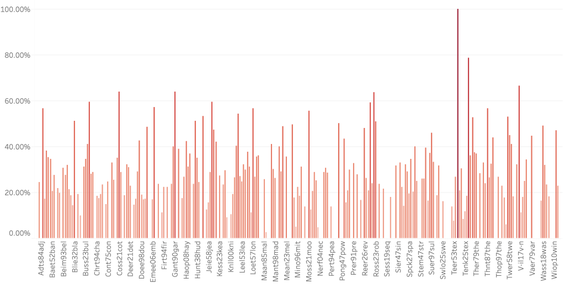
An important detail to remember is that every product is different. Categories such as jeans and dresses often require a more precise fit than sweaters, for example.
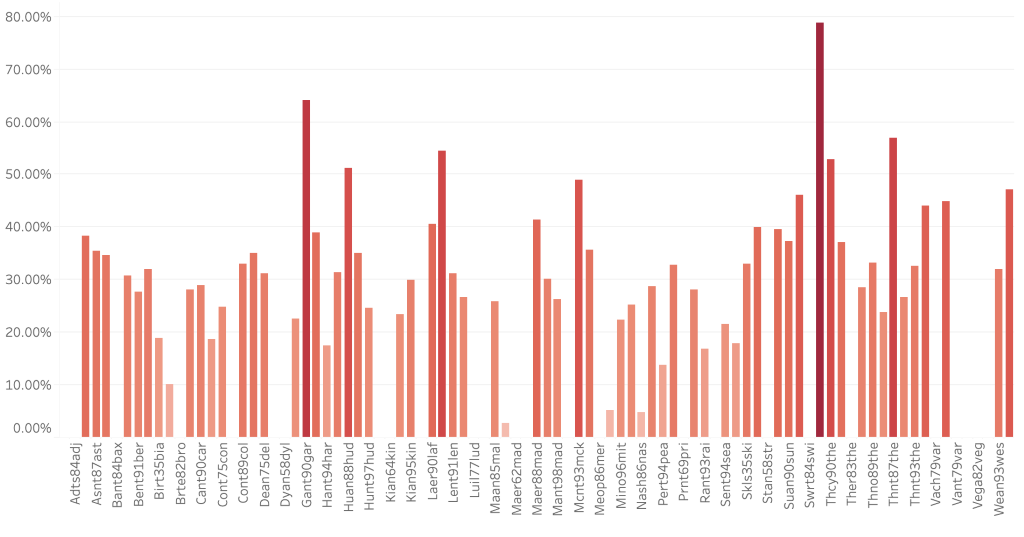
As a result, it can be helpful to group or filter products by larger categories for more meaningful comparison. In this case, we’ll filter to only see products that are designated as pants.
The return rate comes with its limitations.
A product may have a return rate of 80%, which sounds terrible. But if you have only sold 10 units of the product, you may not be too concerned.
Return rate does not indicate volume, so it doesn’t show you the impact of a product’s returns.
For this reason, our team devised a metric called return-to-order differential, which accounts for a product’s contribution to your purchases as well as your returns.
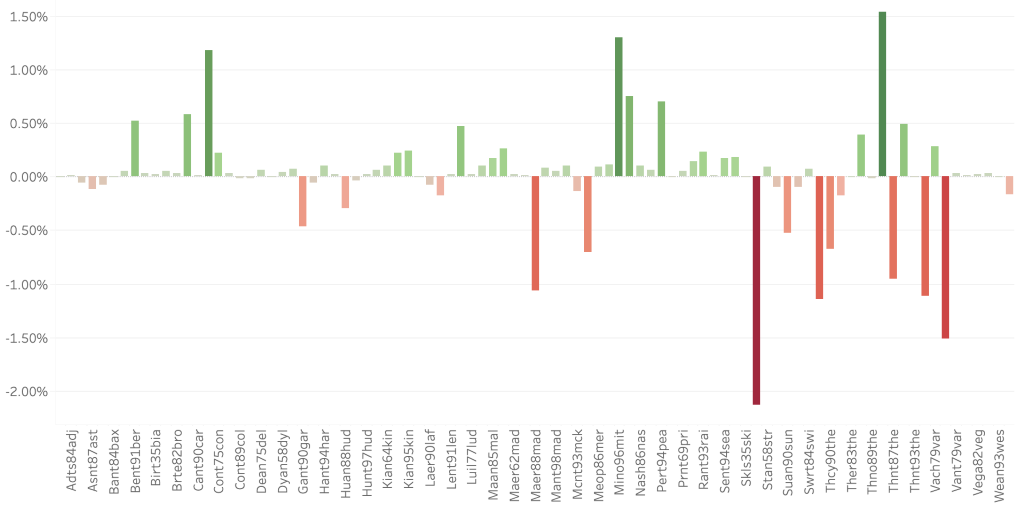
A negative return-to-order differential indicates that a product’s return volume is disproportionately high, whereas a positive return-to-order differential indicates that a product’s return volume is disproportionately low.
In this way, the metric approximates the impact of a product’s returns on your business.
Products with more extreme negative return-to-order differentials may warrant further attention and require a change in product description. From the visual above, there are several products with noticeably negative return-to-order differentials.
And so, we will look into products “Maer88mad,” “Spnt29spr,” and “Vaer79var” to gather more information.
Step 2: Gather Summary Observations
Now that you have pinpointed some products to investigate, you can turn your focus more to why these products were returned to identify if your product descriptions are the issue.
Return reasons are pre-defined reasons, established by the merchant, that the customer chooses from to indicate why they wish to return a product.
Return reasons allow you to quickly summarize the basic reasons behind returns. Used at the product level, this easily demonstrates what may be causing the returns.
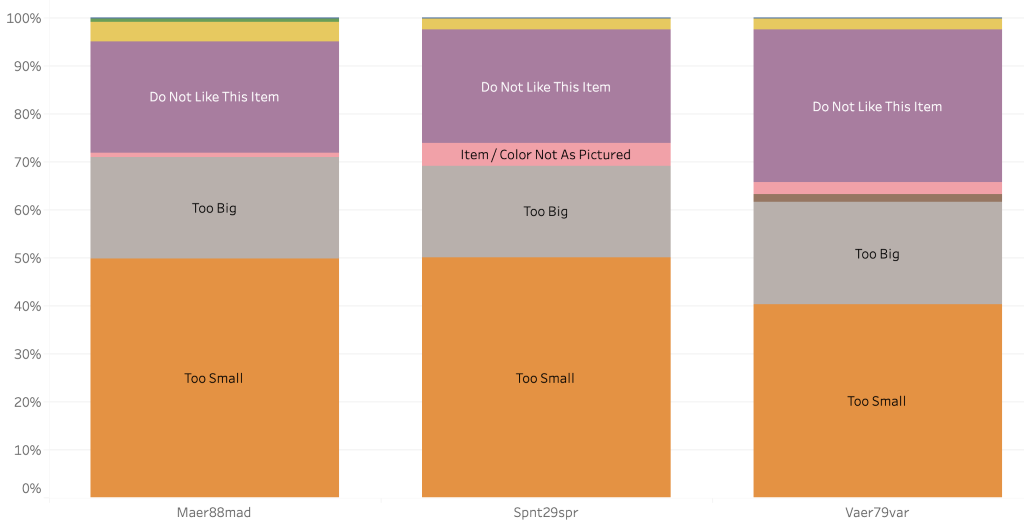
These summary observations will fuel the next step in identifying gaps in product content.
In conjunction with the products themselves, these return reasons will allow you to further narrow your scope to extract actionable insights. For the purpose of this example, we’ll dive into the “Spnt29spr” product with the return reason “Too Small” to find more exact pieces of feedback.
Step 3: Extract Precise Insights
Open-ended return comments may be the most impactful piece of information associated with returns.
A return comment contains precise information, directly from the customer, as to why they are returning the product.
In context, return comments can help explain what area of the product was too small, what customers didn’t like about the fabric, or how the product’s quality didn’t match their expectations.
However, it can be extremely difficult to extract insights from open-ended comments. Imagine reading through hundreds of return comments per month and trying to aggregate any useful information at the product level. It simply does not seem effective.
You can leverage a word cloud to easily spot the most commonly cited words from return comments. You can even see the most used words for a particular product and return reason.
Below, you’ll see some of the most frequently used words in return comments for the “Spnt29spr” product with return reason “Too Small.”
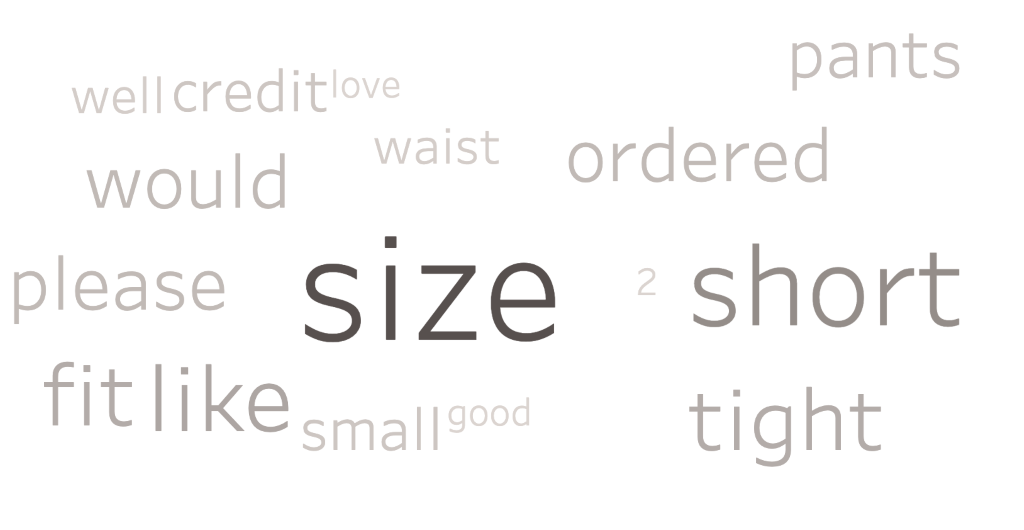
From here, you can select a word that interests you, perhaps “tight” and dive into the exact return comments that contain this word. What about the product is too tight? Is it something that can be corrected in either the product or the product content?
Below, we have the exact return comments “Spnt29spr” product with return reason “Too Small” that contain “tight.”
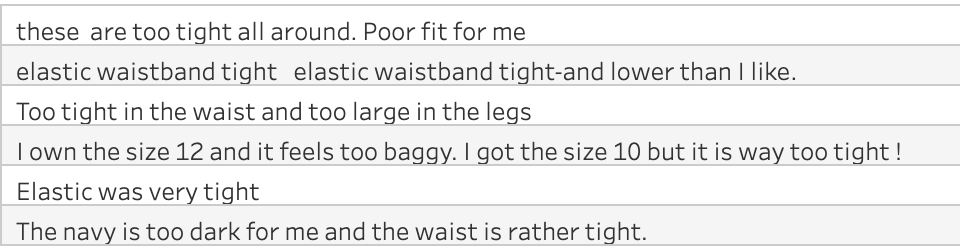
From these comments, it seems as though the elastic waistband may be tighter than customers expect. While this may be a product opportunity to address in the future, we can use product content, such as product descriptions, to better align customer expectations now.
This approach empowers you to quickly summarize the return comments, and then extract more actionable insights from the comments themselves.
To Conclude
The images, product descriptions, and other information you use to represent your products impact a wide spectrum of the customer experience.
Good product content will drive visitors to your site, inspire them to purchase, and lay the groundwork for a happy customer relationship. But imperfect product content is bound to create friction in the customer experience.
Data from returns allows you to identify common issues that customers experience and locate opportunities within your product descriptions.