Reduce Your Return Rate: The Advanced Guide

With an estimated return rate of nearly 30% in ecommerce, and an increasing shift toward online shopping, it’s no surprise that retailers are trying to reduce their return rate more than ever.
Table of Contents:
Returns carry more than just the cost of the lost sale. The expenses of shipping and processing the returned items can easily diminish the profits earned from other sales.
And if the customer experience is disappointing, you may have lost a shopper. As we know, however, returns do not have to cause churn.
Ecommerce data holds a mass of information. But you need an effective method of analysis to extract real insights.
Calculating Return Rate
The two main ways to calculate return rate are return rate by price, and return rate by units.
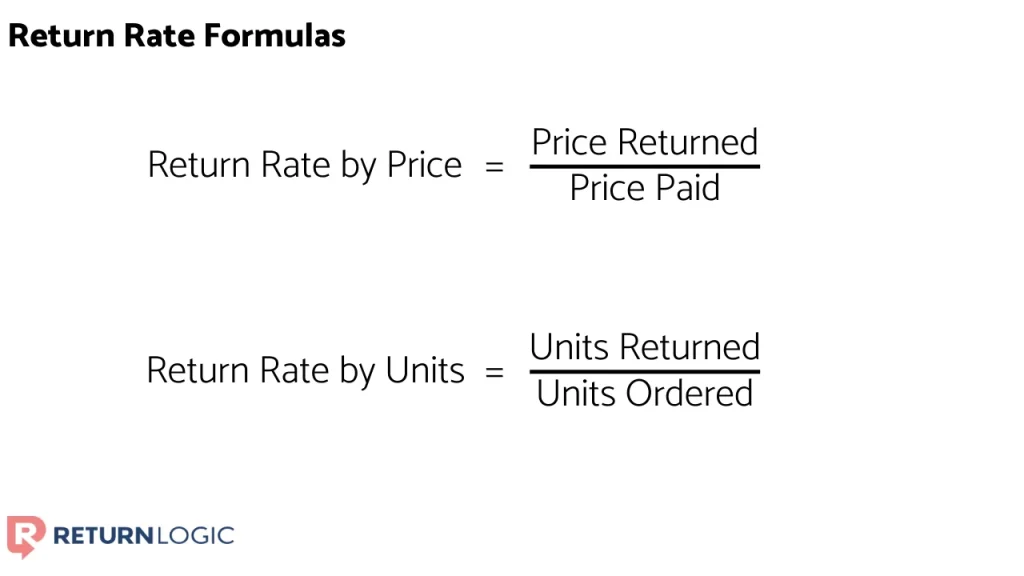
In many cases, the two alternatives will be roughly equivalent. But items such as charitable donations, shipping insurance, and other add-ons can quickly skew either the unit or price volume.
So, it’s best to try both and see which aligns most with your use case.
Meaningful Benchmarks
Like so many things, return rates need context to be useful.
If I told you that the return rate for one of your products was 15%, what would you actually know from that?
Is that good? Is it bad?
To better understand your returns, and act upon them, it is imperative that you establish meaningful levels for comparison.
While the most suitable set of benchmarks is bound to vary from one business to another, let’s lay out some of the most relevant factors.
Product Vendor
If you sell products from a collection of vendors, you can anticipate that returns will differ from one vendor to another.
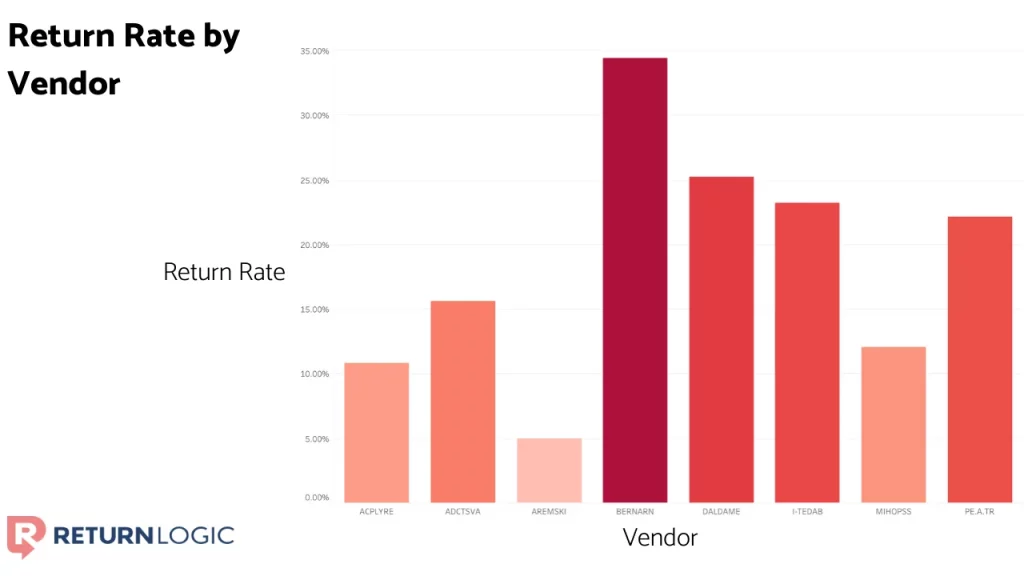
Clearly, the “BERNARN” vendor has the greatest return rate.
If each vendor is supplying a different assortment of products, it would make sense that their return rates would vary.
But if they are supplying comparable items, this can quickly alert us of any potential discrepancies across vendors.
Product Type
Returns vary dramatically across industries. But even within a single vertical, like women’s fashion, for example, returns are bound to be different across product types.
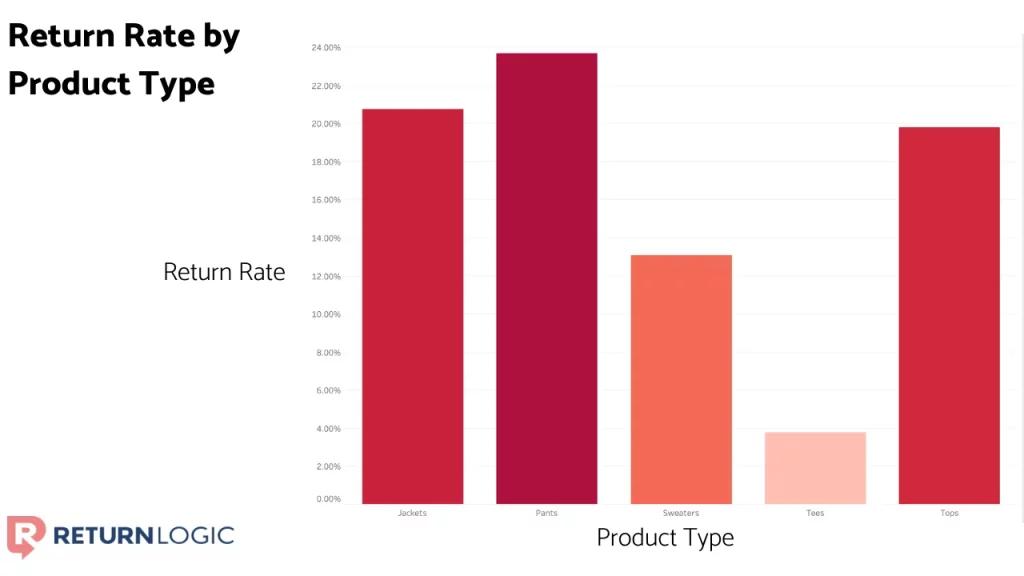
Here, we see the return rates by product type for one retailer.
It appears as though “Pants” are the most difficult for shoppers to order properly, whereas it seems to be much easier in the “Tees” product type.
Product Name
Each product will vary in its return rate, and the most uncertainty exists when you are launching a new product line.
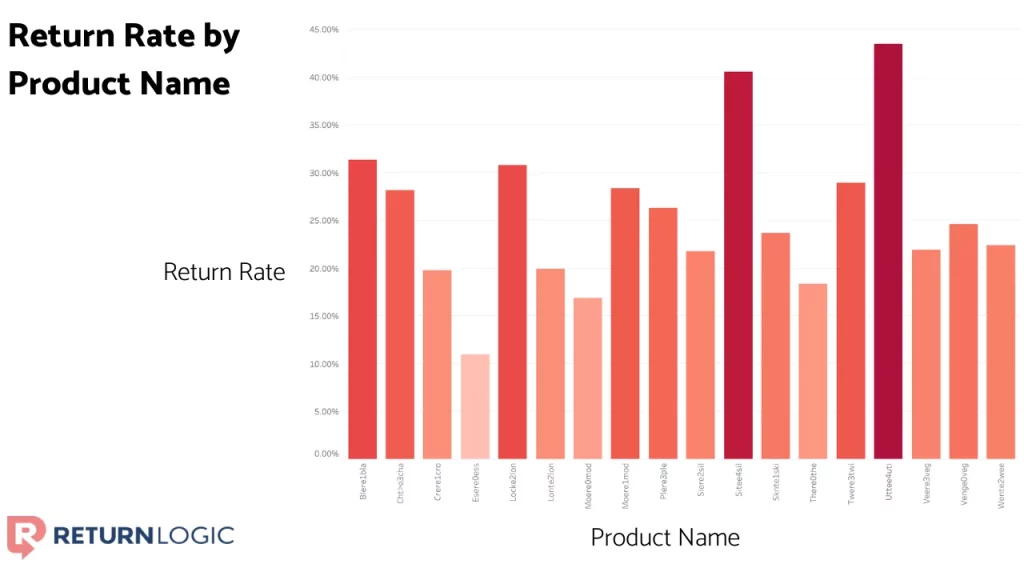
For this retailer, products “Sitee4sil” and “Utee4uti” have the highest return rates.
In the following section, Pinpoint Insights, we’ll lay out a structured flow to identify products and drill down to the root causes of returns.
Product Variant
Intuitively, certain product variants will see higher return rates than others.
This is especially true in sizing.
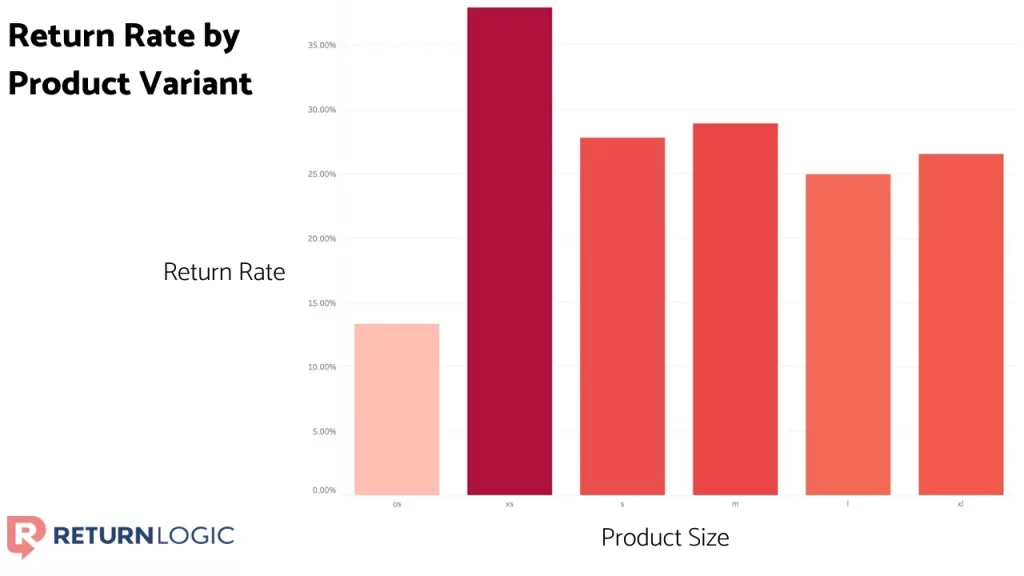
We often see that the “extreme” sizes – the smallest and the largest – have the highest return rates. In the case above, the “xs” size option has the greatest return rate of the different sizes.
Shopper Type
New shoppers tend to have a higher return rate than repeat shoppers.
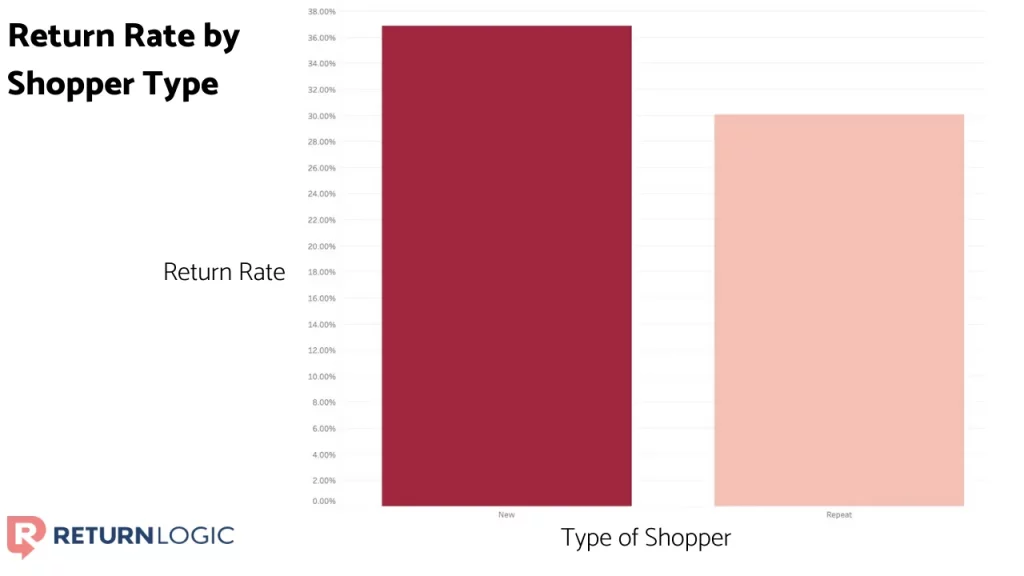
New shoppers are not familiar with your conventions such as sizing, colors, materials and styles.
This effect can be even more prominent in product categories that are heavily reliant on sizing, such as dresses and intimates.
Over Time
Return rates tend to vary over time, often in concurrence with a sales cycle.
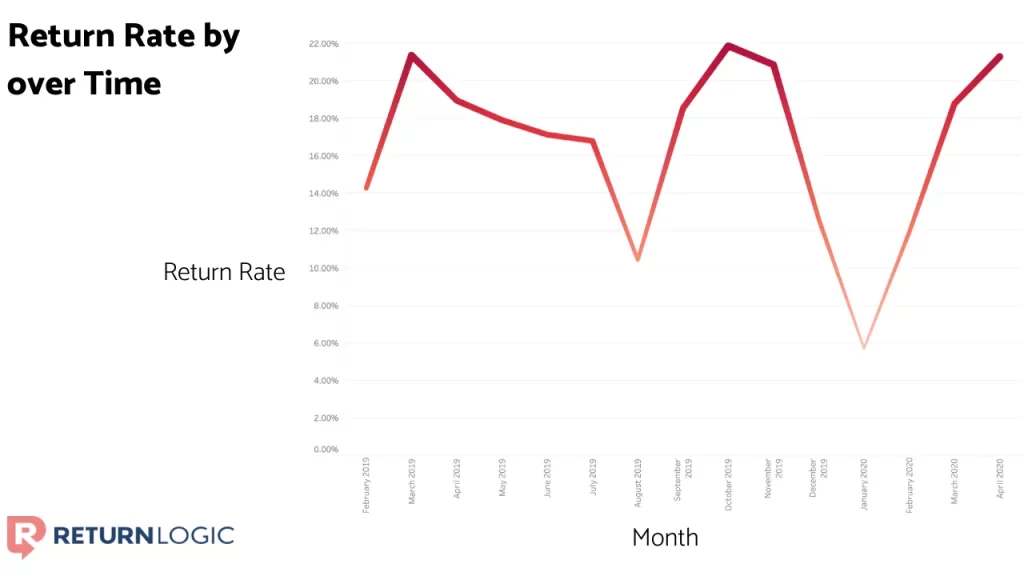
For this brand, we observe peaks in return rate around the months of March and October, which is in-line with their times of new product launches and elevated customer acquisition.
The valleys around August and January match up with this retailer’s end-of-season sales. “Final Sale” and other promotions in these times restrict the volume of returns, which artificially decreases return rate.
Overall, the lesson here is that return rates are influenced by a lot of different factors.
And by finding the right set of benchmark variables for your business, you can get a far better perspective on your returns so you can improve in the future.
Pinpoint Insights
In order to reduce your return rate, you’ll need a lot more than return rate itself. We need a systematic approach to find areas for improvement, and insights to drive action.
The basic flow of analyses here starts with return rates to identify products to focus on, then return reasons to gather summary insights, and finally return comments to extract direct feedback.
Let’s go through a real example for a retailer we partner with!
Return Rates – Identify Products
Return rates are great for identifying categories, products, or variants that are underperforming.
Benchmarks, such as those covered in the previous section, can be used to establish meaningful points of comparison.
So, we’ll start by analyzing the return rates of products within a particular product type.
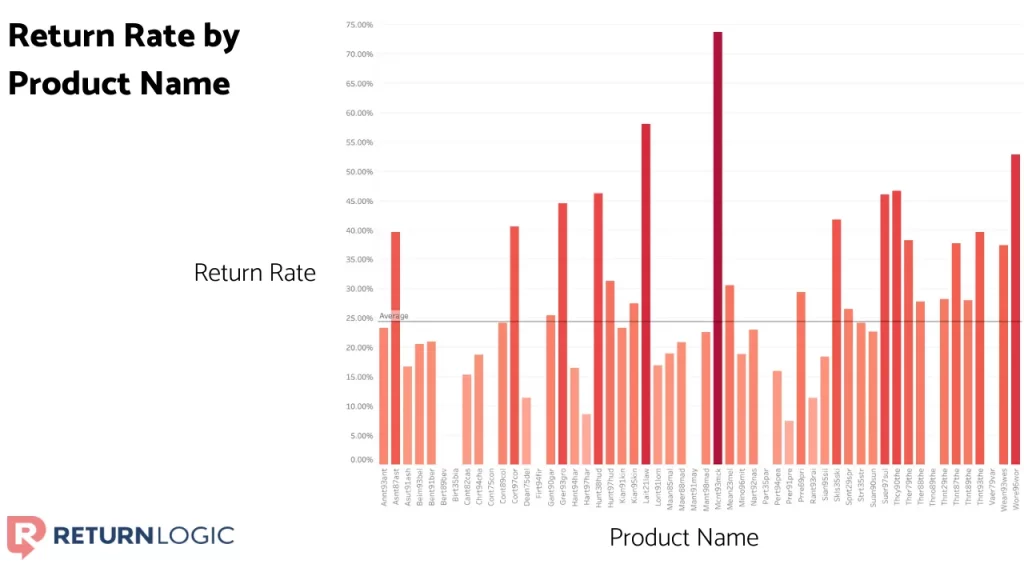
From this image, we can clearly spot which products have the highest return rates, and how each return rate compares to the average for this product type.
But this doesn’t necessarily tell you which products to prioritize.
An item may have a return rate of 75%, but that doesn’t matter nearly as much if you have sold few units.
We need more context to isolate particular products for enhancement.
For this purpose, it can be beneficial to compare a product’s proportion of total orders to its proportion of total returns. This is a derivative of return rate that we will refer to as the return-to-order differential.
Essentially, how much a product is purchased versus how much the product is returned.
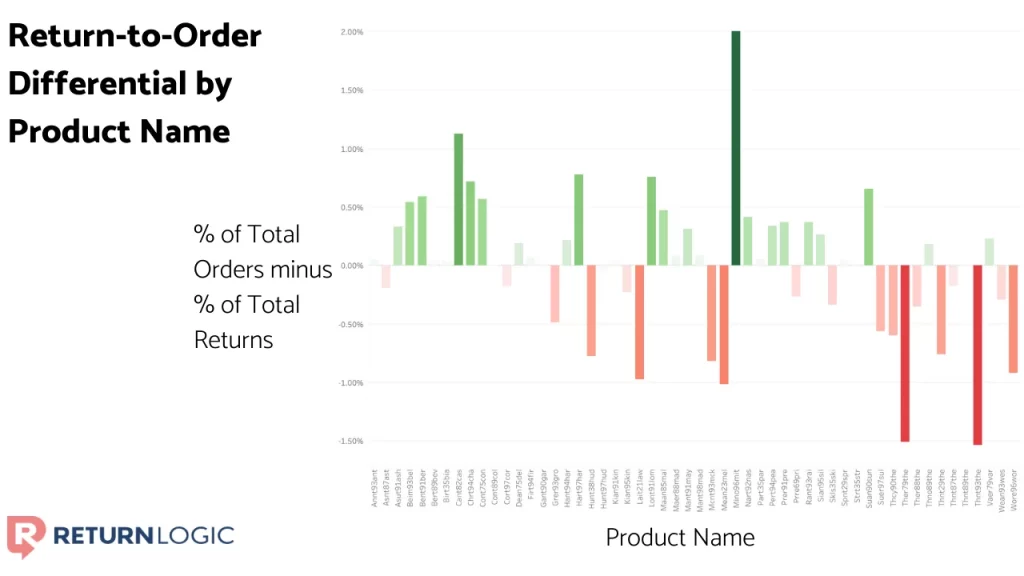
In this graphic, a green bar represents a product with a positive return-to-order differential. This means that a product has comprised a greater percentage of purchases than it has returns.
These are products that we do not need to worry about for now.
A red bar, on the other hand, indicates a negative return-to-order differential. A product with a negative value has made up a disproportionate volume of returns given its order volume.
We should now further examine these products to understand why they are being returned. This will then allow us to correct for the underlying concerns.
Return Reasons – Summary Insights
So, we can select several of those items and dive into their return reasons.
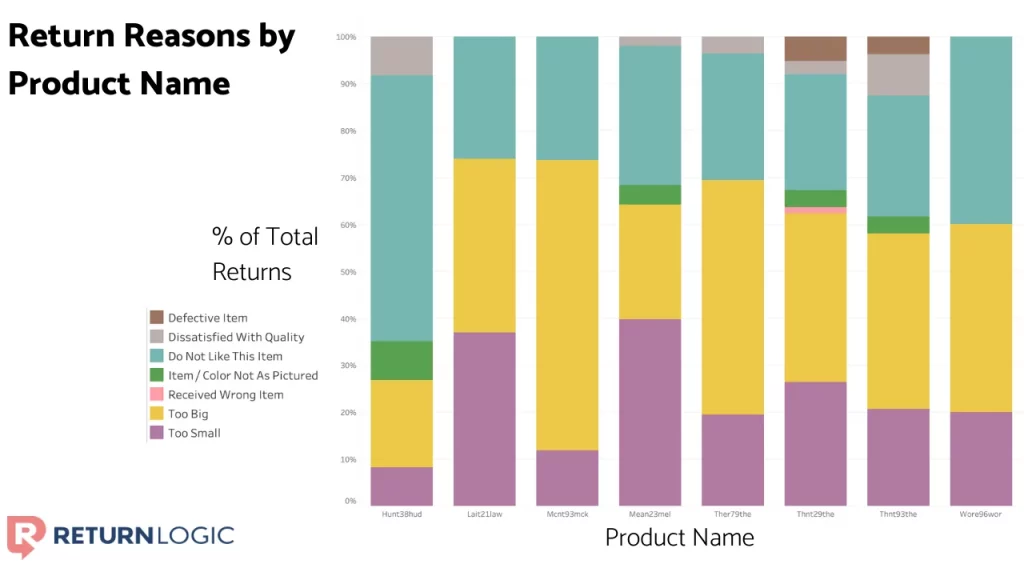
Now, we have solid surface-level understanding as to why these products are being returned.
“Hunt38hud,” for example, is most commonly returned for the reason “Do Not Like This Item.” This is a more vague return reason, but we can investigate this product further in open-ended return comments.
“Mcnt93mck,” on the other hand, is skewing far in the direction of “Too Big.”
“Thnt93the” seems to have reasonable percentage of quality or defect cases, and skews slightly more toward “Too Big” than “Too Small”.
With these summary insights in hand, we can examine return comments to find exact issues that shoppers are experiencing.
Return Comments – Precise Feedback
In this step, let’s look into the return comments for some of these cases, with hopes of narrowing down on exact issues.
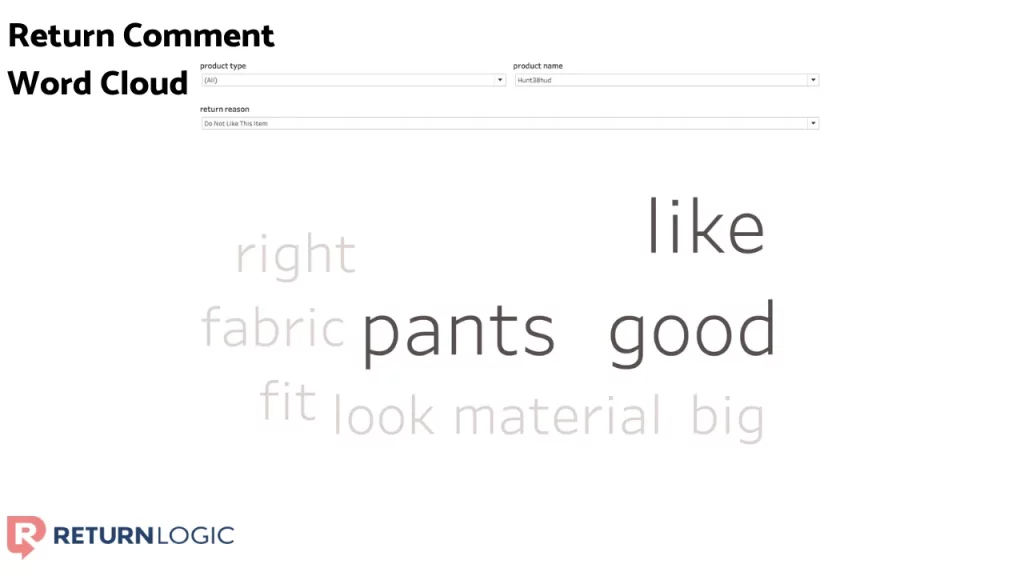
In the case of “Do Not Like This Item” for “Hunt38hud,” we see that both “fabric” and “material” are prevalent in the return comments.
This tells us that we may wish to reconsider the material used in this product for next season, or at least plan on adjusting the images and product description to better reflect the current fabric.
We can also investigate the quality concerns within the “Thnt93the” product.
One shopper’s comment says it all:
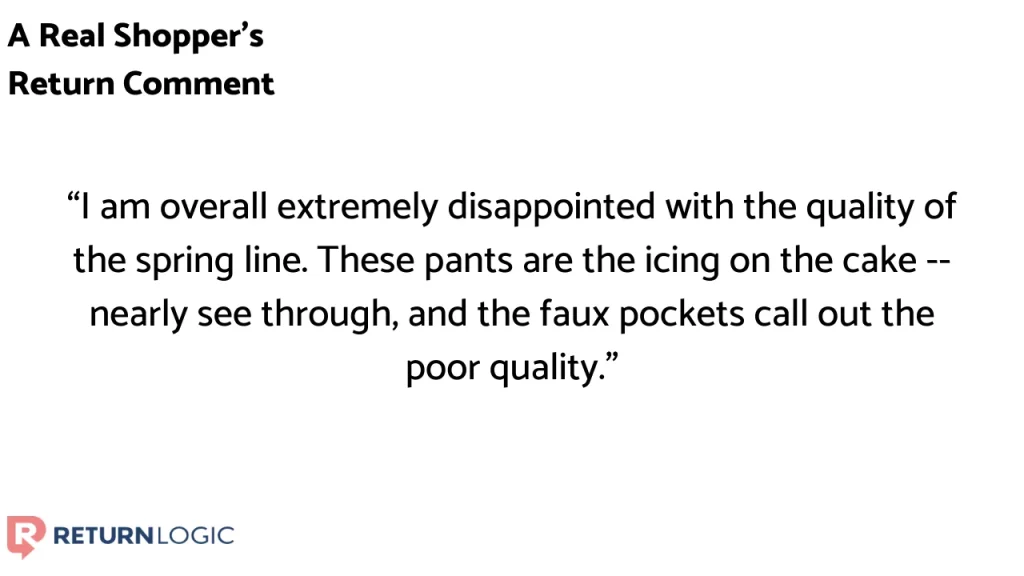
Return comments offer precise, open-ended feedback directly from shoppers. They often contain loads of actionable insights.
The challenge of return comments is that it can be difficult to extract meaningful feedback at scale.
But, using a word cloud as a starting point, we can effectively navigate these open-ended comments.
This enables you to investigate either top-down or bottom-up.
You can use the word cloud to uncover and explore new issues. But you can also search any terms that may already be on your radar.
Regardless, a basic flow of analyses prevents us from getting lost in the data, and empowers you to go from information to insight as efficiently as possible.
Making an Impact
Now that we have gathered specific insights, it’s time to formulate a course of action.
It’s important to remember at this stage that a return indicates a misalignment between the shopper’s expectation and reality.
So, in order to alleviate common causes of returns, we can make adjustments to either the product or the shopper’s perception of the product.
The shopper’s perception of a product is shaped mainly by the product page. But ads, emails, and other content mediums can build expectations, as well.
You can use your return reasons as a checklist for your product pages. Make sure that each of the underlying issues of your return reasons is addressed in some way.
Social proof, in the form of reviews and customer-uploaded images, can go a long way to more accurately shape the perception of a shopper.
It is often far cheaper to enhance a product page than it is to augment a product itself.
But if the circumstances warrant it, particularly if there are widespread quality concerns, a change to the product may prove to be effective.
Retailers leverage returns data to advise the materials, product lines, and even suppliers they use.
Whether a change is made to the product itself, or to the perception of the product, you can save tens of thousands of dollars in sales revenue by preventing returns before they happen.
Concluding Thoughts
Even 30 years after the dawn of ecommerce, returns are still one of the most complex and pervasive challenges in the industry.
Retailers know that returns carry a variety of costs.
From lost sales revenue, to shipping expenses, labor costs, and the potential for a lost customer – it is more effective to reduce returns rather than react to them.
But the challenge is not a lack of interest. It’s a lack of visibility into returns data, and the absence of a structured approach to extract insights.
This is a key element of returns management solutions.
Reducing return rate creates value for both retailers and their shoppers. That means more profit and a happier customer base.