Ecommerce Returns: How to Use Returns Data to Grow Your Shopify Store

E-commerce returns are a deep well of insights that can help you improve your products, better understand your customers, and streamline your operational workflows.
Too often, e-commerce retailers view product returns as an afterthought. A dispassionate returns page, strict policies, and a manual process – what else do you need?
We see that return rates among apparel brands typically fall in the vicinity of 20% to 30% or higher conditional on the product category. By the 3rd purchase, anywhere between 30% and 40% of shoppers for several of our retailers had returned at least one item.
It would be an understatement to say that product returns are prevalent in e-commerce.
Table of Contents:
- Improve Your Products with E-commerce Returns Data
- Sizing uncertainty is a major cause of e-commerce returns
- Keep your e-commerce returns data clean by using consistent return reasons
- Quickly spot issues by looking at frequently used words in returns comments
- Learn About Your Shoppers with Ecommerce Returns Data
- 3 key questions to ask when evaluating acquisition & retention
- Using returns data to segment your customers into clusters
- Every e-commerce return is a retention marketing opportunity
- Evaluate and Improve Your Operations Processes with Ecommerce Returns Data
- Report #1: Average order fulfillment time by week
- Report #2: Average order to ship time by day of the week
- Report #3: RMA status report
- Report #4: Average RMA delivery to complete by week
Many retailers are fighting to attract new shoppers. They spend the majority of revenue from their purchases on the acquisition. However, about a quarter of purchasers make a return and endure what can be the most painful experience in e-commerce. This is the problem that returns management solutions strives to solve.
This Post Features Expert Insights from:

Research indicates that the majority of shoppers would be less likely to shop with a retailer again after going through a poor return experience.
Not to mention the revenue that is lost in a return, shipping the item back, receiving and processing it, and the risk that the item may not be acceptable to resell.
The concern of product returns may never be completely resolved. However, the burden they create can be alleviated.
Optimize Your Business for Profit with Ecommerce Returns Data
Our fundamental objective is to improve the e-commerce returns process, for retailers and shoppers alike. This involves an easy experience for the shopper and less work for the warehouse or 3PL.
However, our greater mission is to help retailers optimize their businesses to compete in an Amazon vs. everyone world.
The fact is, true returns management is a profit center.
We see product returns as a natural part of the e-commerce lifecycle – an event that can constantly be analyzed and improved. This is the onset of returns data.
Just as sales data shows you what has worked, returns data can illustrate what didn’t work.
Looking at both provides you a more comprehensive picture of your products and shoppers, as well as your own processes.
1. Improve Your Products with Ecommerce Returns Data
Ecommerce retailers and their shoppers do not enjoy the benefit of physical interaction that a brick-and-mortar store provides.
A shopper in-store can experience the product in ways an online shopper simply can’t.
If the pants are too snug in the calf, look for a different cut. If you typically wear a medium but the top was still a little loose – just try sizing down. You purchased a dress online and it wasn’t the perfect fit? Guess you’ll have to send it back.
Despite their best efforts, ecommerce retailers will continue to struggle with product returns.
As we mentioned, return rates around 20% to 30% are standard among online fashion brands, with certain sub-categories reaching even higher.
In order to mitigate the friction and costs that result from returns, many retailers are turning to some form of Shopify returns management software, which automates and streamlines their return process.
Sizing Uncertainty is a Major Cause of Ecommerce Returns
And while most solutions will save a great deal of time, they often fail to provide retailers with the insights they need to inform improvements to products or the website itself.
Not all product returns have a single source of fault. However, many returns are correctable for the retailer, or even the fault of the retailer. We took a look at four of our most prevalent apparel retailers, and here are the percentages of returns due to sizing for each: 66.5%, 54.4%, 62.2%, and 56.7%.
Gulnaz Khusainova, CEO and Founder of the size and fit platform EasySize cites sizing uncertainty as one of the greatest sources of friction for shoppers in e-commerce.
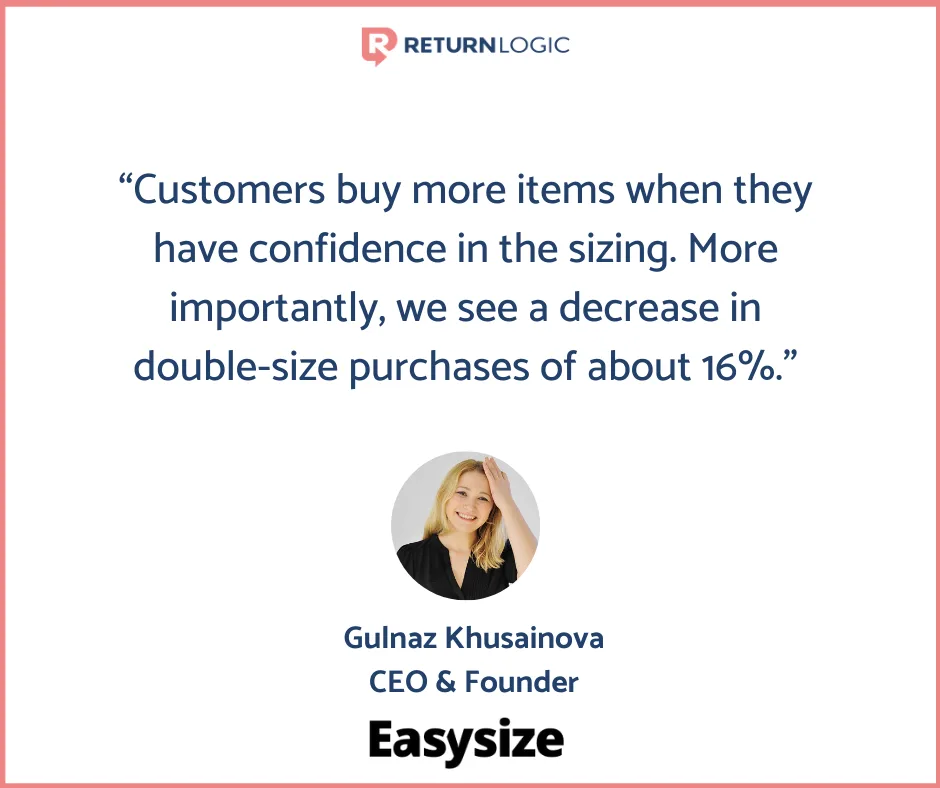
Misleading product photos, inaccurate descriptions, and inconsistent sizing conventions are driving factors of product returns. And they all lay in the hands of the retailer.
Regardless of your category or industry, feedback from shoppers is a critical component of success in e-commerce. It can make or break a retailer.
Product returns, while traditionally considered a cost, can act as a valuable piece of shopper feedback, providing incredibly insightful information that would not otherwise be available.
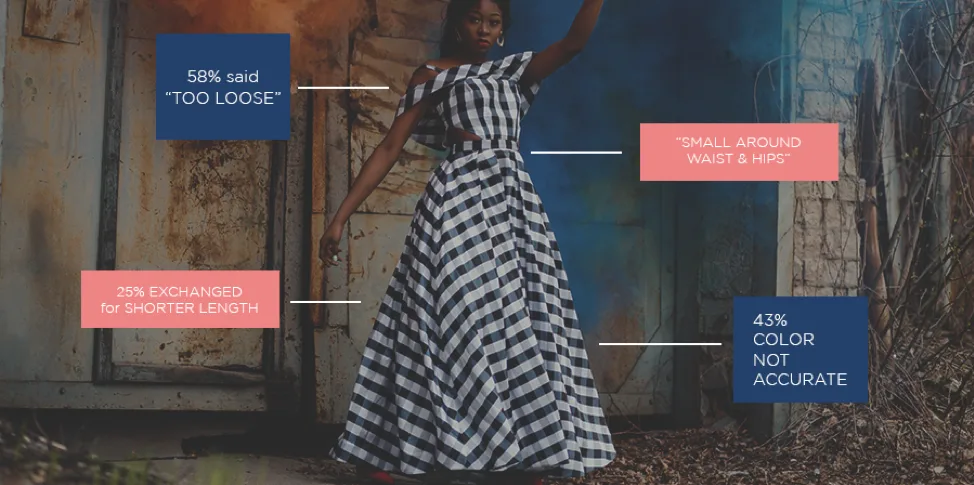
At the heart of every return is a misalignment between the shopper’s expectation and reality.
Retailers can capitalize on this by using it as an opportunity to recognize what they can do to advance the product and the shopper experience in the future. Returns data is a must if you want to reduce your return rate.
Retailers attempting to streamline the return process by including a return shipping label with a purchase are missing out on an abundance of actionable information.
Keep Your E-commerce Returns Data Clean by Using Consistent Return Reasons
A great way to get started with returns data is by collecting general return reasons for each product returned. These basic reasons should cover most if not all potential reasons while not overlapping much. Including “Too Big,” “Too Small,” and “Size” as potential reasons would distort the interpretability of all three.
And of course, these reasons will vary depending on your product assortment. As you can imagine, reasons for returning a designer coat may be different from those for returning tech accessories.
Below is an example of return reasons and their occurrences for a retailer that specializes in women’s fitness apparel. Notice that the reasons they opted to use account for most foreseeable reasons, with minimal redundancy.
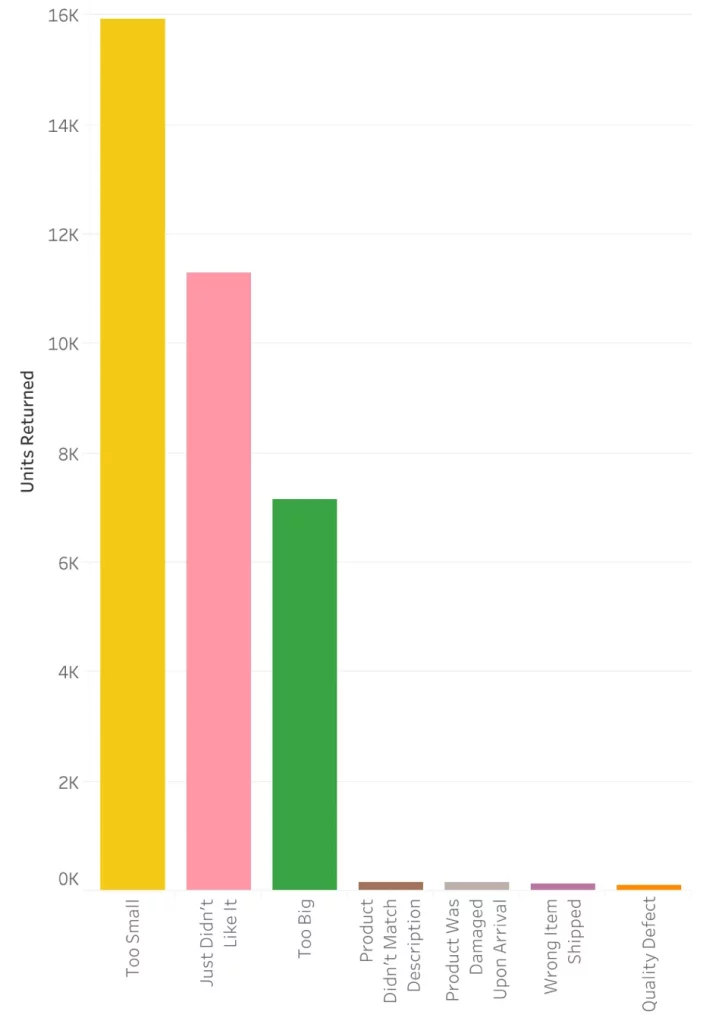
Aggregating these return reasons provides you with a quantitative summary of why your products are being returned. While these codes provide a nice overview, it is still useful to combine this with more detailed feedback.
When a shopper says a product was “Too Small,” what does she mean?
Was the fit too tight? Was it the length? Was it not flattering in certain areas? While lumped under the same general return reason, these may have entirely different implications.
Quickly Spot Issues by Looking at Frequently Used Words in Returns Comments
To identify specific problems with products, you need to incorporate both standardized return reasons and open-ended feedback from your shoppers.
This combination of data points enables you to look at your product returns from a 10,000-foot view, identify areas of concern, and then zoom in at particular comments.
Return Comment Word Cloud:
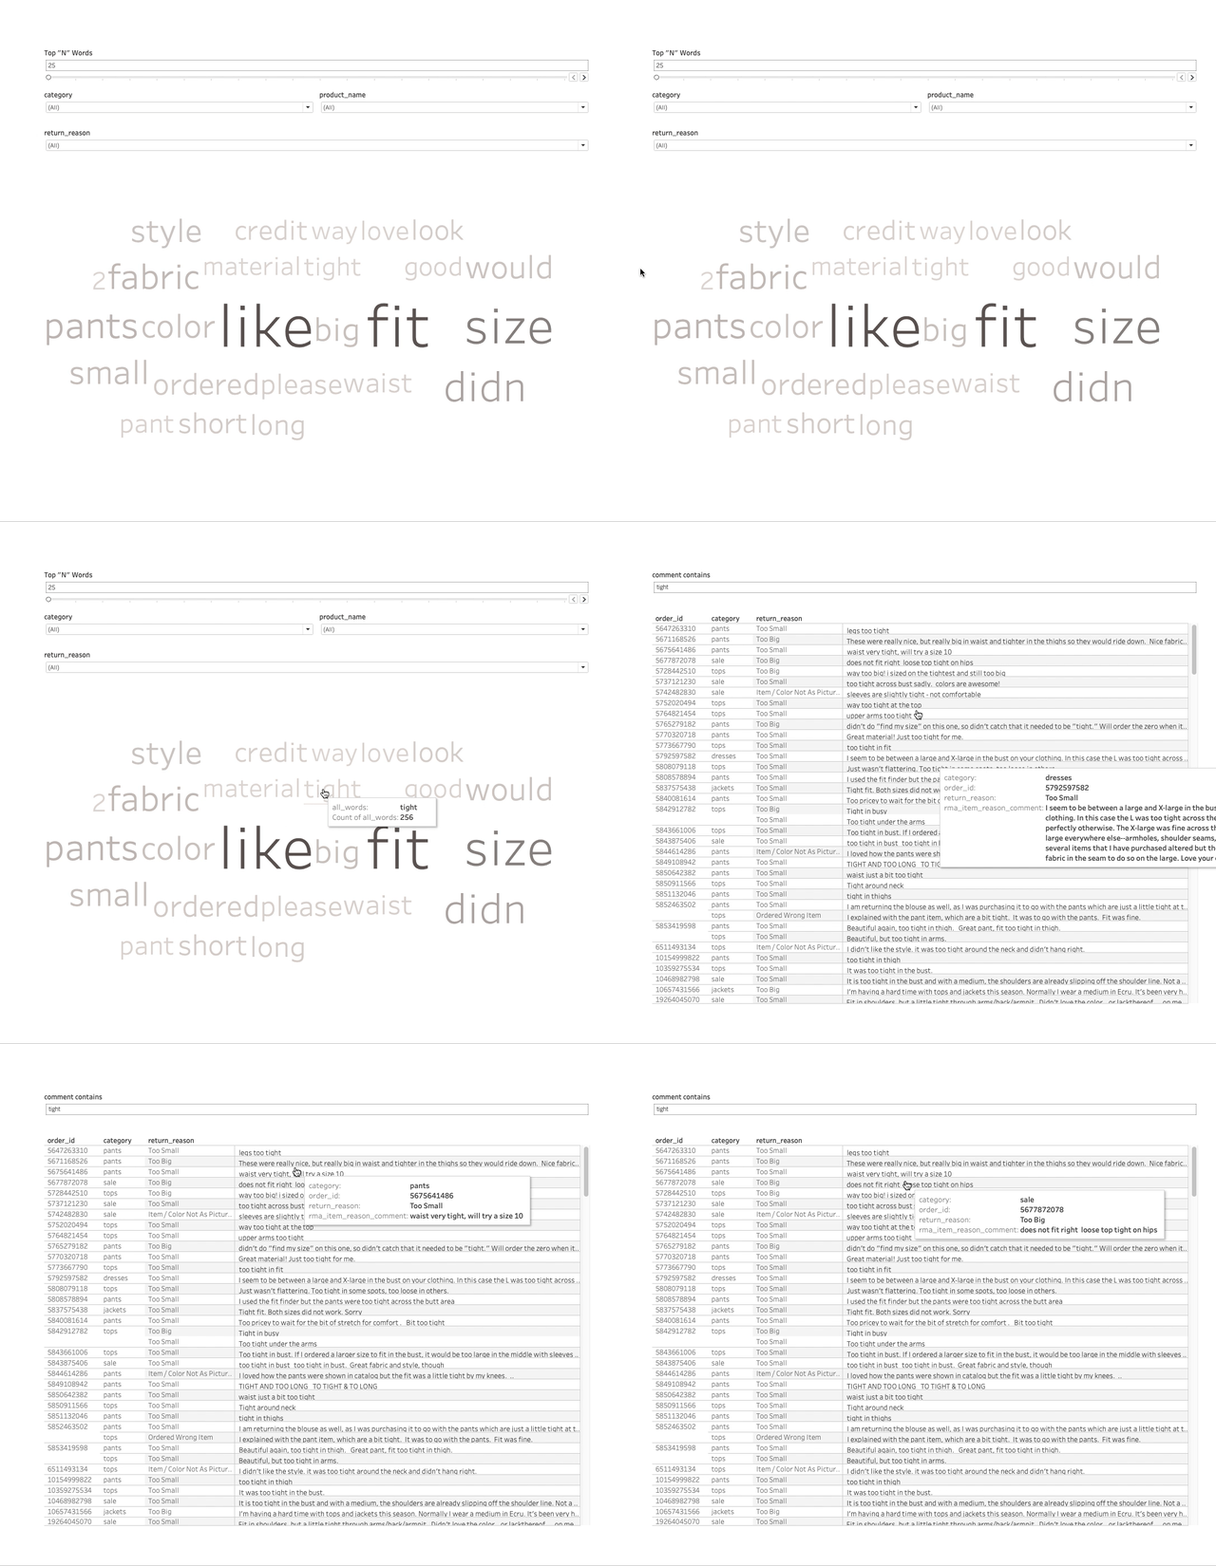
Then, you can seek to address common issues. This may include updating product descriptions, correcting your sizing chart, revising the product design, or investigating issues within manufacturing. All made possible by returns data.
A fashion brand we work with observed an alarming return rate following a new product launch. After a quick examination of open-ended return comments, they confirmed that the fabric did not come out as intended.
Retailers take pride in their products. Returns data can quickly spot points of friction for shoppers that would otherwise be missed.
2. Learn About Your Shoppers with Ecommerce Returns Data
We spoke with Jon Stern, the VP of Client Experience at omnichannel marketing platform Retention Rocket. And we could not have summed it up better ourselves: “A return isn’t a loss. It’s a customer that was close to getting what they wanted.”
A key challenge for retailers in the ecommerce space is getting to know their shoppers – their interests, their purchase patterns, their challenges.
You can learn a lot about a shopper’s needs and relationship with a brand without ever meeting them.
While return comments are especially relevant to the products being returned, they are also a valuable window into the shopper’s experience.
Return comments provide unique feedback, both positive and negative, that can shine a light not only on the shortcomings a particular shopper encountered but possibly greater issues that may otherwise go unnoticed.
We have seen that the content of these comments can be very expressive of the sentiment the shopper is feeling, as well as predictive of whether or not she will buy again.
For example: “I cannot even begin to describe how utterly disappointed and shocked I am that you screwed up the world’s simplest thing – a silk shirt. Who is your tailor? Is that person utterly stupid or just malicious?”
We help retailers monitor shopper acquisition and retention, which is especially important as a retailer grows and its goals evolve.
3 Key Questions to Ask When Evaluating Acquisition & Retention:
- What portion of revenue is coming from new versus repeat shoppers?
- How has this changed over time?
- How do product returns change across purchases?
It’s widely accepted that shopper retention is critical for survival in ecommerce. The acquisition makes a business. Retention makes it successful.
But when are shoppers likely to repurchase? It may be sooner than you expect.
We see across retailers that the most common time for a repurchase tends to be within a day of the original purchase, and there is a rough decay in the days following.
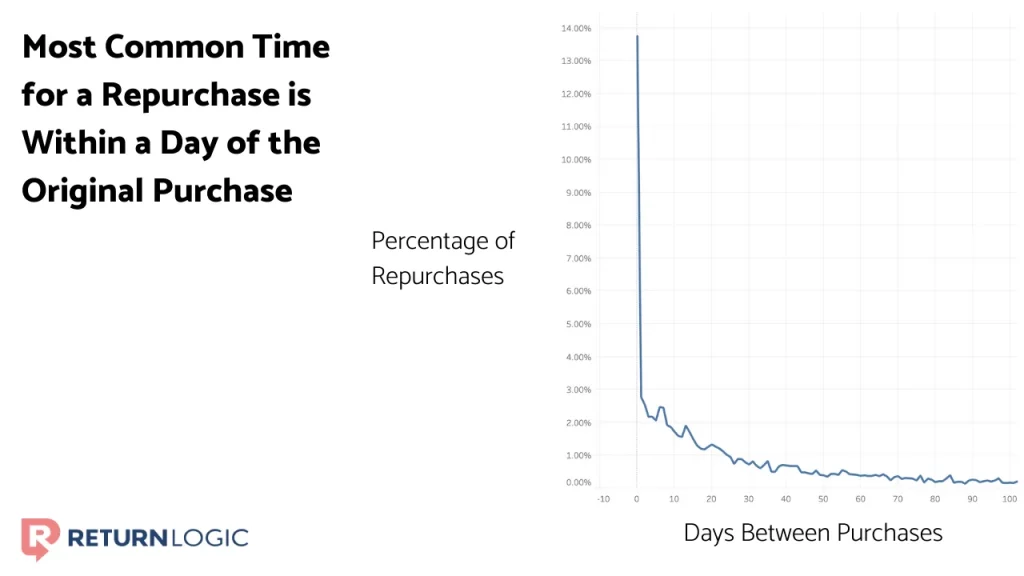
While many of these may simply be cases where shoppers quickly regret not adding other products to their cart, it illustrates the point that shoppers are most likely to be active in the time directly following the purchase.
For both purchases and returns alike, the days following are crucial for retention.
Additionally, the details behind a return can influence whether or not the shopper will buy again, so it is vital to learn from returns data, especially with regards to how product returns impact the shopper experience.
Our analyses have shown that for several of our retailers, return reasons such as “Just Didn’t Like It” or “Product Didn’t Match Description” were far less likely to see repurchases than returns due to a simple sizing issue.
Jake Pasini, Senior Director of Strategy Services at Listrak, explained to us, “People who honestly select ‘too big’ or ‘too small’ are probably very interested in the item but just literally need to get a different size. Selecting ‘too big’ or ‘too small’ implies future purchase intent whereas ‘didn’t match description’ does not – at least not to the same degree.”
Return reasons that are detrimental to the shopper experience should be prioritized for remedy, and warrant different touchpoints with the shopper following the return.
As Elysse Ciccone, Agency Marketing Manager at Noticed, articulated, “When your products don’t meet a customer’s expectations, you’re not just winning back their business – you’re winning back their trust.”
You battled to acquire this shopper, now strive to retain her. And returns data can complete the picture of her particular journey.
Using Returns Data to Segment Your Customers into Clusters
Your shoppers are not all alike, and it would not make sense to treat them as such. Purchase and returns data can be combined to segment shoppers, allowing retailers to pinpoint specific needs and patterns for each group.
The RFM framework is a great way to do so. RFM characterizes shoppers by their Recency, Frequency, and Monetary value to a retailer. Increasingly, RFM is being used by industry experts to better recognize segments of shoppers.
Looking at several of our fashion retailers, we noticed that various patterns of purchase behavior emerge.
The Brand Champions:
The most valuable shoppers tend to be frequent shoppers, recent as well. This means that they do not wait long after a purchase to make another, and have been active recently.
They also tend to have the lowest return rate.
The Up-and-Comers:
The next in line exhibits similar behavior to those highest value shoppers but simply have not shopped with the brand as long. Nurture these individuals, they could be your next MVPs.
The “Don’t Let Them Go!” Crew:
These shoppers have spent a lot with a retailer, bought pretty frequently, but have not purchased recently. Win them back while you can.
The Cherry Blossoms:
Just like their namesake – these individuals do not come by often, but they sure are beautiful when they do. Their purchase frequency indicates that a great deal of time transpires between purchases, yet they are still fairly high-value shoppers.
At the very least, maintain this cyclical behavior. And if you can reasonably do so, find ways to engage them more regularly.
The Dead and Goners:
These shoppers have most likely moved on. They have not been in a while and returned a lot of products when they did.
Though it may no longer be worth trying to win them back, find ways to learn from their experiences to better acquire and retain shoppers in the future.
Every Ecommerce Return is a Retention Marketing Opportunity
Insights from sales and returns data can transform returns into a retention opportunity, by informing what products to recommend for an exchange.
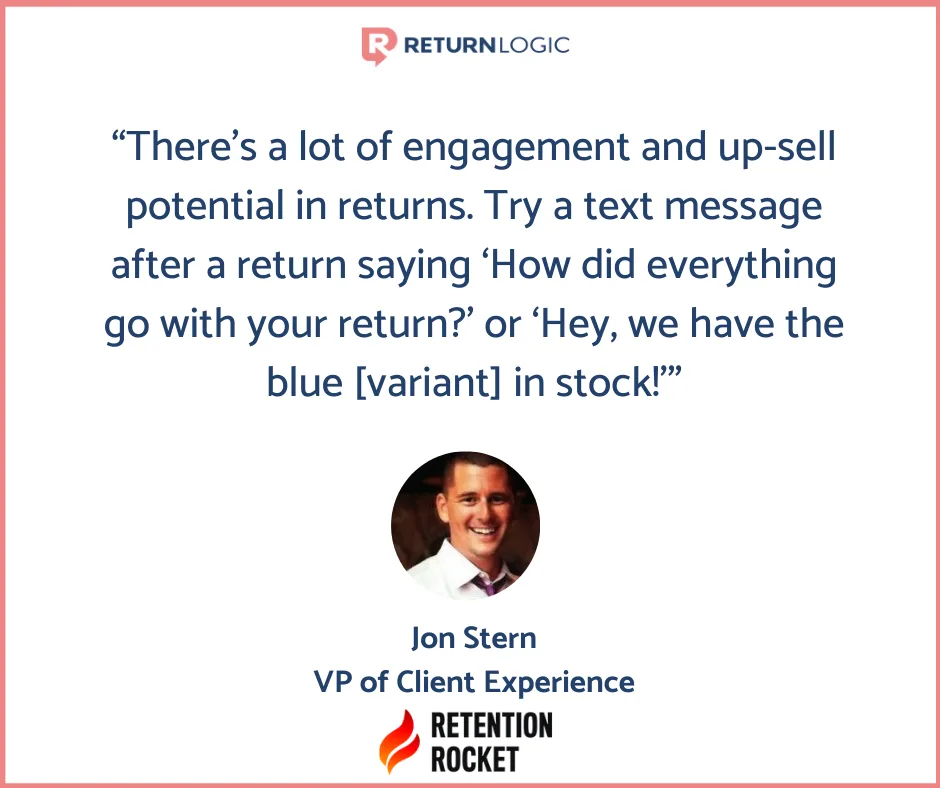
Stern elaborated for us, “I actually really like the idea of sending a text message after a return saying ‘How did everything go with your return?’ or ‘Hey, we have the blue [variant] in stock!’ There’s a lot of engagement and up-sell potential in returns.”
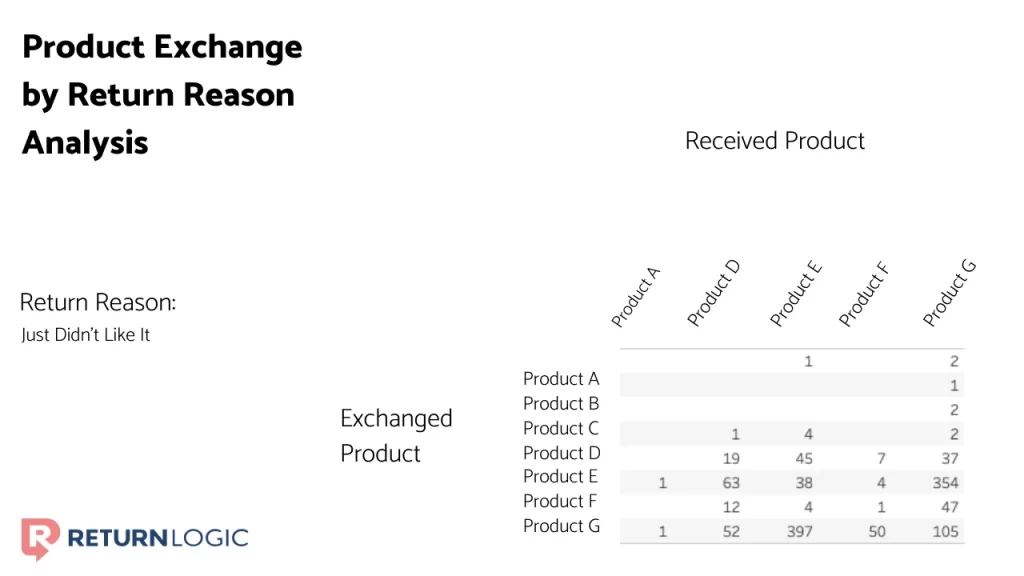
We see that the reason a shopper cites for returning a product is an excellent indicator of what item they may want for an exchange. Intuitively, when the reason listed for returning a product is “Too Small,” for example, the most common exchange is for the same product but in a larger size.
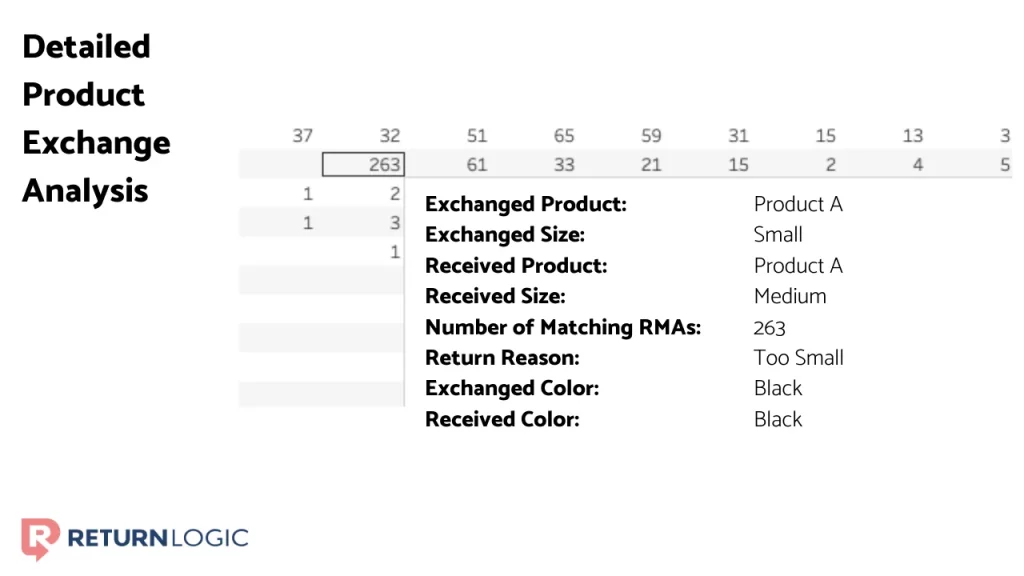
But if the reason is something like “Just Didn’t Like It,” then the shopper is far more likely to exchange for a different product altogether.
The objective is to assist you in reaching the right customers with the right message at the right time – optimizing your business to reach your goals.
3. Evaluate and Improve Your Operations Processes with Ecommerce Returns Data
Though the operational processes of a retailer may seem pertinent only to the retailer itself, they have a substantial impact on the customer experience.
Imagine ordering a new swimsuit online and it arrives after the big pool party. Or returning a product, and not receiving your refund for several weeks because of the retailer’s returns process.
That experience simply cannot compete in today’s ecommerce landscape. As Dotcom Distribution confirms, shoppers want both free and timely.
Blending sales and returns data, the ReturnLogic team has created an assortment of operational reports that help retailers improve their own processes, both in terms of the forward supply chain and reverse supply chain.
As a quick example, we will look at a couple of reports for a retailer who crafts accessories for tech products.
Forward Supply Chain
Report #1: Average Order Fulfillment Time by Week
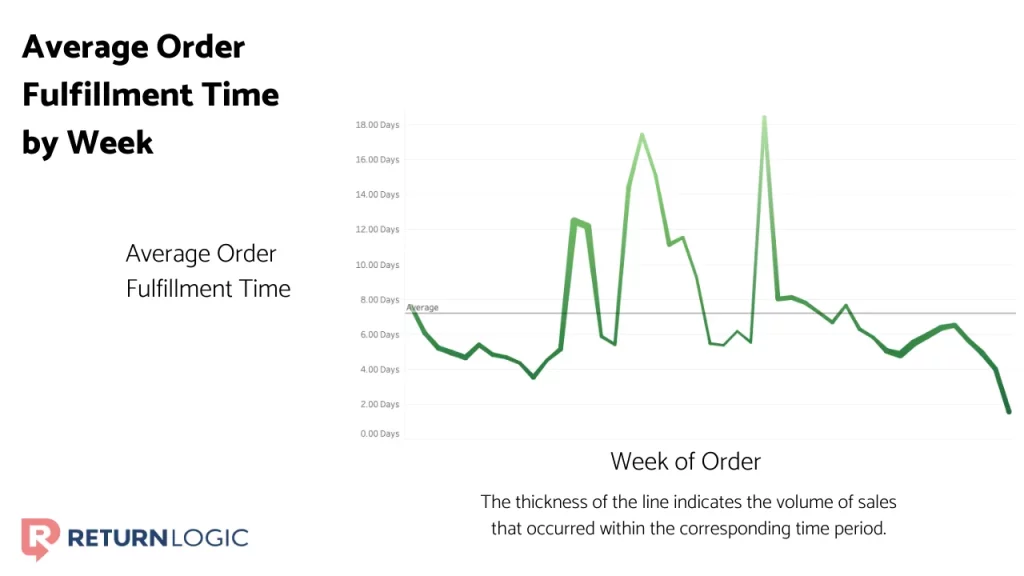
Here, we are looking at the average order fulfillment time for the retailer.
Fulfillment time is indicating the amount of time between orders being created and being marked as shipped.
It’s no mystery that shoppers want their products fast. This view empowers the retailer to monitor the fulfillment process to stabilize and reduce the time required to fill an order.
Report #2: Average Order to Ship Time by Day of the Week
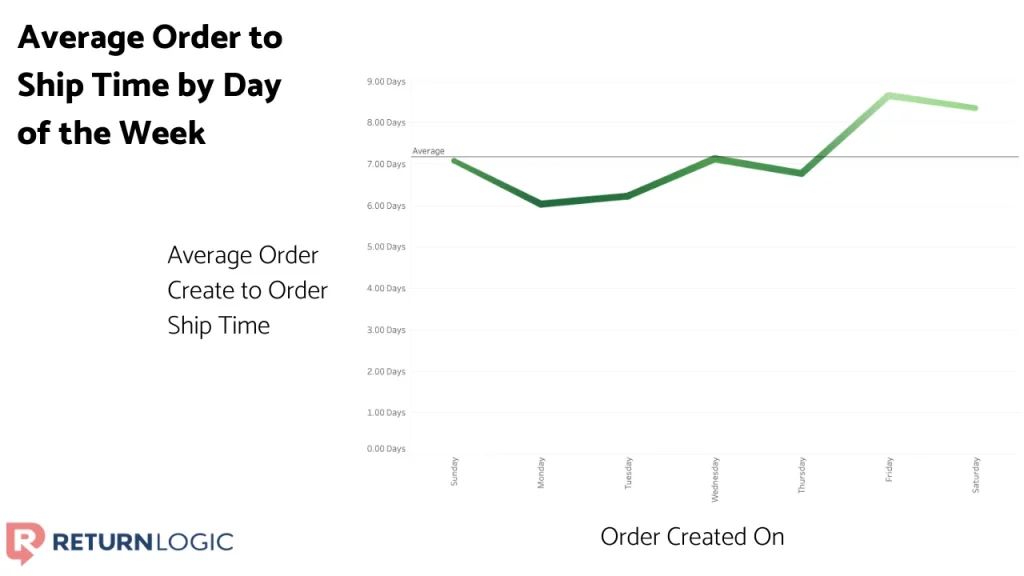
This graph shows the same time interval, but by the weekday that the order was created. Orders placed Monday tend to be filled the fastest, whereas orders created on Friday tend to have the longest time until shipment.
Using this, the retailer can pull levers such as staffing, resource prioritization, and even operating hours to ensure a smooth customer experience.
Reverse Supply Chain
Just as in the case of fulfillment in the forward supply chain, retailers can use data to improve operations in returns, the reverse supply chain.
Report #3: RMA Status Report
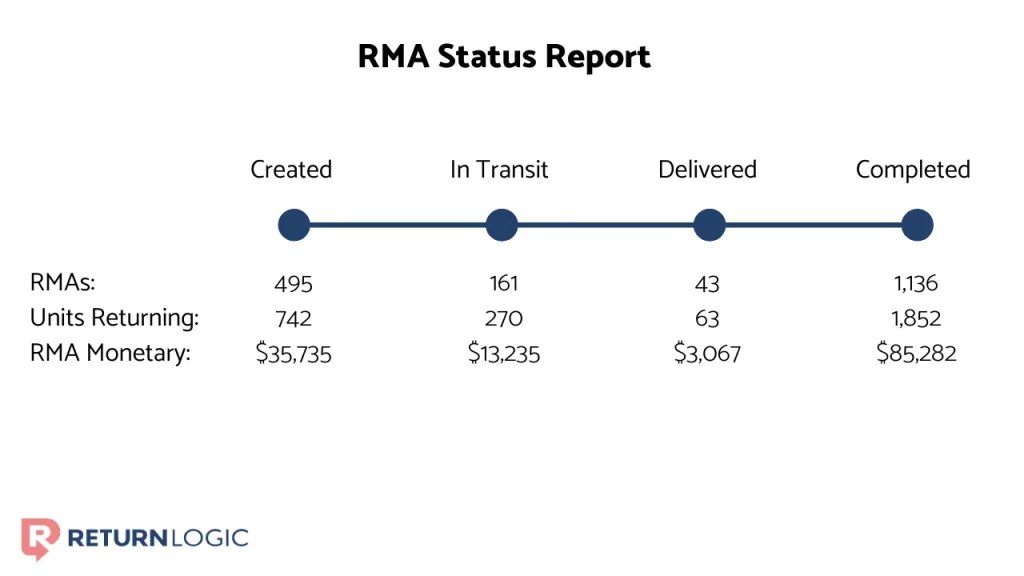
Simply put, this report provides the retailer with a snapshot of how many returns sit at each stage in the returns process. It provides visibility so bottlenecks can be identified and handled quickly.
Report #4: Average RMA Delivery to Complete by Week
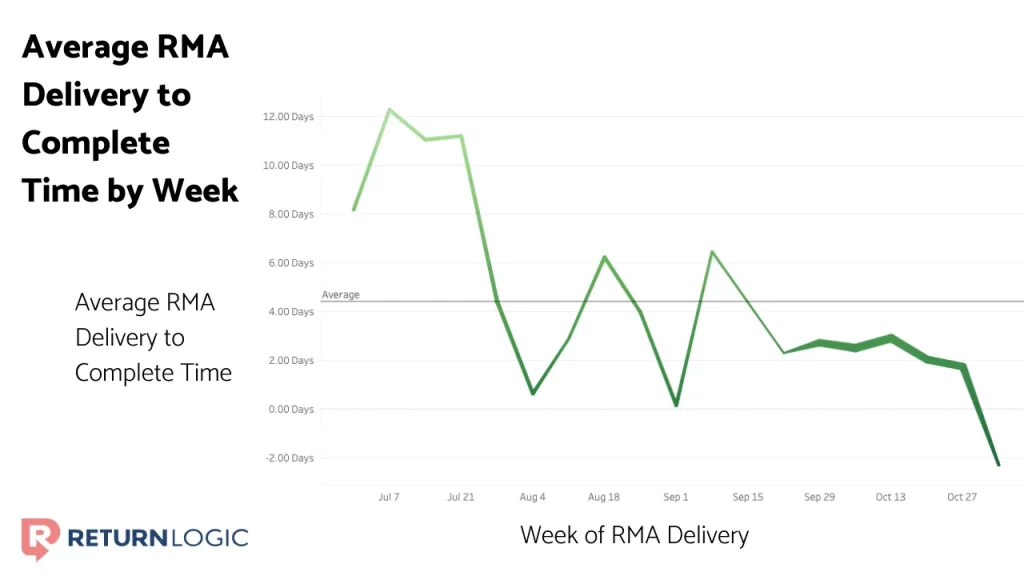
This graphic illustrates the average time to complete a return upon delivery to the warehouse, over time. The interval has stabilized and decreased over the last several months, which is a positive sign from the perspective of operations and customer service.
Whether it be a slower time of the year or a holiday rush, operational visibility is the foundation of better ecommerce processes.
An unfortunate reality for ecommerce retailers is that not all returned products will be suitable to resell when they arrive back.
Khusainova of EasySize also states that around 30% of returned merchandise is typically disposed of, and we can confirm that almost the exact same percentage of products returned to one of our retailers in 2019 were either dirty or damaged.
Product dispositions reflect the condition that returned products are in upon their arrival at the retailer’s warehouse or 3PL.
Many products will be good enough to resell and some will need to be thrown away, but it’s the mid and lower states that can either retain or lose a lot of sales revenue.
Bring It All Together
The days of disregarding product returns are over. Now, the name of the game is more effectively managing those returns, reducing future returns, and creating a better overall experience for shoppers. Welcome to the emergence of returns data.

Jon Stern of Retention Rocket gave us an excellent lens to view returns: “You want to be brand-centric in every part of the journey, so the return should get as much thought as everything else.”
We know that e-commerce returns data can help retailers learn more about their businesses, particularly concentrating on products, shoppers, and operational processes.
We set out to improve the Shopify returns experience. We’re learning along the way that product returns are not just a single problem, and they definitely do not exist in a vacuum.
Rather, returns are a channel to a deeper issue. These issues are a disruption to the customer experience. And when viewed through the right lens, returns can be a powerful competitive advantage.


